Image Recognition
The BlueROV2 is equipped with a forward-facing camera on a gimbal. We will be using this camera to detect objects in the water.
OpenCV
OpenCV is a library of programming functions mainly aimed at real-time computer vision. It is open-source and free for commercial use. It is written in C++ and has bindings for Python.
Installation
On the backseat computer, we will be using OpenCV with Python.
Create a new virtual environment and install OpenCV:
mkvirtualenv -p python3 bluecv
workon bluecv
pip install opencv-python-headless
Now, fork cv-intro and clone it in the home directory.
Open the cv-intro folder in VSCode.
Create a new Jupyter notebook:
touch test.ipynb
Open the file in VSCode and add the following code:
import cv2
import numpy as np
import matplotlib.pyplot as plt
Run the code and make sure it works.
If you get an error, make sure:
- You are in the
bluecvvirtual environment. VSCode should display the name of the virtual environment in top right corner of the Jupyter notebook. - You installed all the dependencies.
Try installing them with
pip install [...]. This should be run in the virtual environment.
Reading Images
To read an image, use the imread function:
img = cv2.imread('image.jpg')
The image is stored as a NumPy array.
To display the image, use the imshow function:
plt.imshow(img)
Reading Videos
To read a video, use the VideoCapture function:
cap = cv2.VideoCapture('video.mp4')
To read the video frame by frame, use the read function:
ret, frame = cap.read()
Drawing on Images
To draw a line on an image, use the line function:
cv2.line(img, (0, 0), (100, 100), (255, 0, 0), 5)
To draw a rectangle on an image, use the rectangle function:
cv2.rectangle(img, (0, 0), (100, 100), (0, 255, 0), 5)
To draw a circle on an image, use the circle function:
cv2.circle(img, (50, 50), 50, (0, 0, 255), 5)
To draw a polygon on an image, use the polylines function:
pts = np.array([[10, 5], [20, 30], [70, 20], [50, 10]], np.int32)
pts = pts.reshape((-1, 1, 2))
cv2.polylines(img, [pts], True, (0, 255, 255), 5)
To draw text on an image, use the putText function:
cv2.putText(img, 'Hello World!', (0, 130), cv2.FONT_HERSHEY_SIMPLEX, 1, (255, 255, 255), 2, cv2.LINE_AA)
Visualize the image using plt.imshow(img) after each drawing operation to see the result.
Line Detection
Hough Transform
The Hough transform is a feature extraction technique used in image analysis, computer vision, and digital image processing. The purpose of the technique is to find imperfect instances of objects within a certain class of shapes by a voting procedure.
Probabilistic Hough Transform
The probabilistic Hough transform is an optimization of the Hough transform. It is a straight line detection method. It returns the start and end points of the detected lines.
Example
gray = cv2.cvtColor(img, cv2.COLOR_BGR2GRAY) # convert to grayscale
edges = cv2.Canny(gray, 50, 150, apertureSize=3) # detect edges
lines = cv2.HoughLinesP(
                edges,
                1,
                np.pi/180,
                100,
                minLineLength=100,
                maxLineGap=10,
        ) # detect lines

for line in lines:
    x1, y1, x2, y2 = line[0]
    cv2.line(img, (x1, y1), (x2, y2), (0, 255, 0), 2)

plt.imshow(img)
- Run the code above and make sure it works.
- What do the parameters of the
HoughLinesPfunction do? - What happens if you change the parameters?
- What happens if you change the
minLineLengthandmaxLineGapparameters? - What happens if you change the
apertureSizeparameter of theCannyfunction? - What happens if you change the
threshold1andthreshold2parameters of theCannyfunction? - Modify the code to detect pool lanes.
April Tags
AprilTags are a type of fiducial marker. They are designed to be easily detected by computer vision algorithms. They are used in robotics for localization and navigation.
Installation
On the backseat computer, we will be using [Python bindings for the Apriltags 3 library by Duckietown]( ](https://github.com/duckietown/lib-dt-apriltags)
In the same virtual environment as before, install the library:
pip install dt-apriltags
Example

Download the image above and save it as test_image.png.
In a terminal, run the following command:
wget https://raw.githubusercontent.com/duckietown/lib-dt-apriltags/daffy/test/test_files/test_image.png
Back in the Jupyter notebook, add the following code:
from dt_apriltags import Detector
img = cv2.imread('test_image.png', cv2.IMREAD_GRAYSCALE)
at_detector = Detector(families='tag36h11',
                       nthreads=1,
                       quad_decimate=1.0,
                       quad_sigma=0.0,
                       refine_edges=1,
                       decode_sharpening=0.25,
                       debug=0)
tags = at_detector.detect(img, estimate_tag_pose=False, camera_params=None, tag_size=None)
color_img = cv2.cvtColor(img, cv2.COLOR_GRAY2RGB)
for tag in tags:
    for idx in range(len(tag.corners)):
        cv2.line(color_img, tuple(tag.corners[idx - 1, :].astype(int)), tuple(tag.corners[idx, :].astype(int)), (0, 255, 0))

    cv2.putText(color_img, str(tag.tag_id),
                org=(tag.corners[0, 0].astype(int) + 10, tag.corners[0, 1].astype(int) + 10),
                fontFace=cv2.FONT_HERSHEY_SIMPLEX,
                fontScale=0.8,
                color=(0, 0, 255))
plt.imshow(img)
The result should look like this:
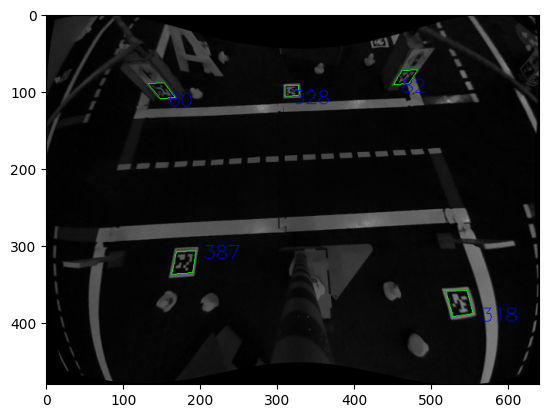
- Run the code above and make sure it works.
- What do the parameters of the
Detectorfunction do? - What happens if you change the parameters?
- What are
families? - What does
estimate_tag_posedo? - What does
camera_paramsdo? - What does
tag_sizedo? - The
detectfunction returns a list of tags. What information does each tag contain? - Modify the code to give the position and orientation of each tag.
Problem set
Problem 1: Lane Detection
In a new file lane_detection.py:
-
Write a python function
detect_linesthat takes an image as an input and returns a list of detected lines. The function should take the following parameters:img: the image to processthreshold1: the first threshold for the Canny edge detector (default: 50)threshold2: the second threshold for the Canny edge detector (default: 150)apertureSize: the aperture size for the Sobel operator (default: 3)minLineLength: the minimum length of a line (default: 100)maxLineGap: the maximum gap between two points to be considered in the same line (default: 10)
-
Write a python function
draw_linesthat takes an image and a list of lines as inputs and returns an image with the lines drawn on it. The function should take the following parameters:img: the image to processlines: the list of lines to drawcolor: the color of the lines (default: (0, 255, 0))
-
Write a python function
get_slopes_interceptsthat takes a list of lines as an input and returns a list of slopes and a list of intercepts. The function should take the following parameters:lines: the list of lines to process
The function should return the following parameters:
slopes: the list of slopesintercepts: the list of horizontal intercepts
-
Write a python function
detect_lanesthat takes a list of lines as an input and returns a list of lanes. The function should take the following parameters:lines: the list of lines to process
The function should return the following parameters:
lanes: the list of lanes
The function should do the following:
- Get the slopes and intercepts of the lines using the
get_slopes_interceptsfunction. - Check if a pair of lines is a lane.
- Return the list of lanes. Each lane should be a list of two lines.
-
Write a python function
draw_lanesthat takes an image and a list of lanes as inputs and returns an image with the lanes drawn on it. Each lane should be a different color. The function should take the following parameters:img: the image to processlanes: the list of lanes to draw
Test your code with the following image:
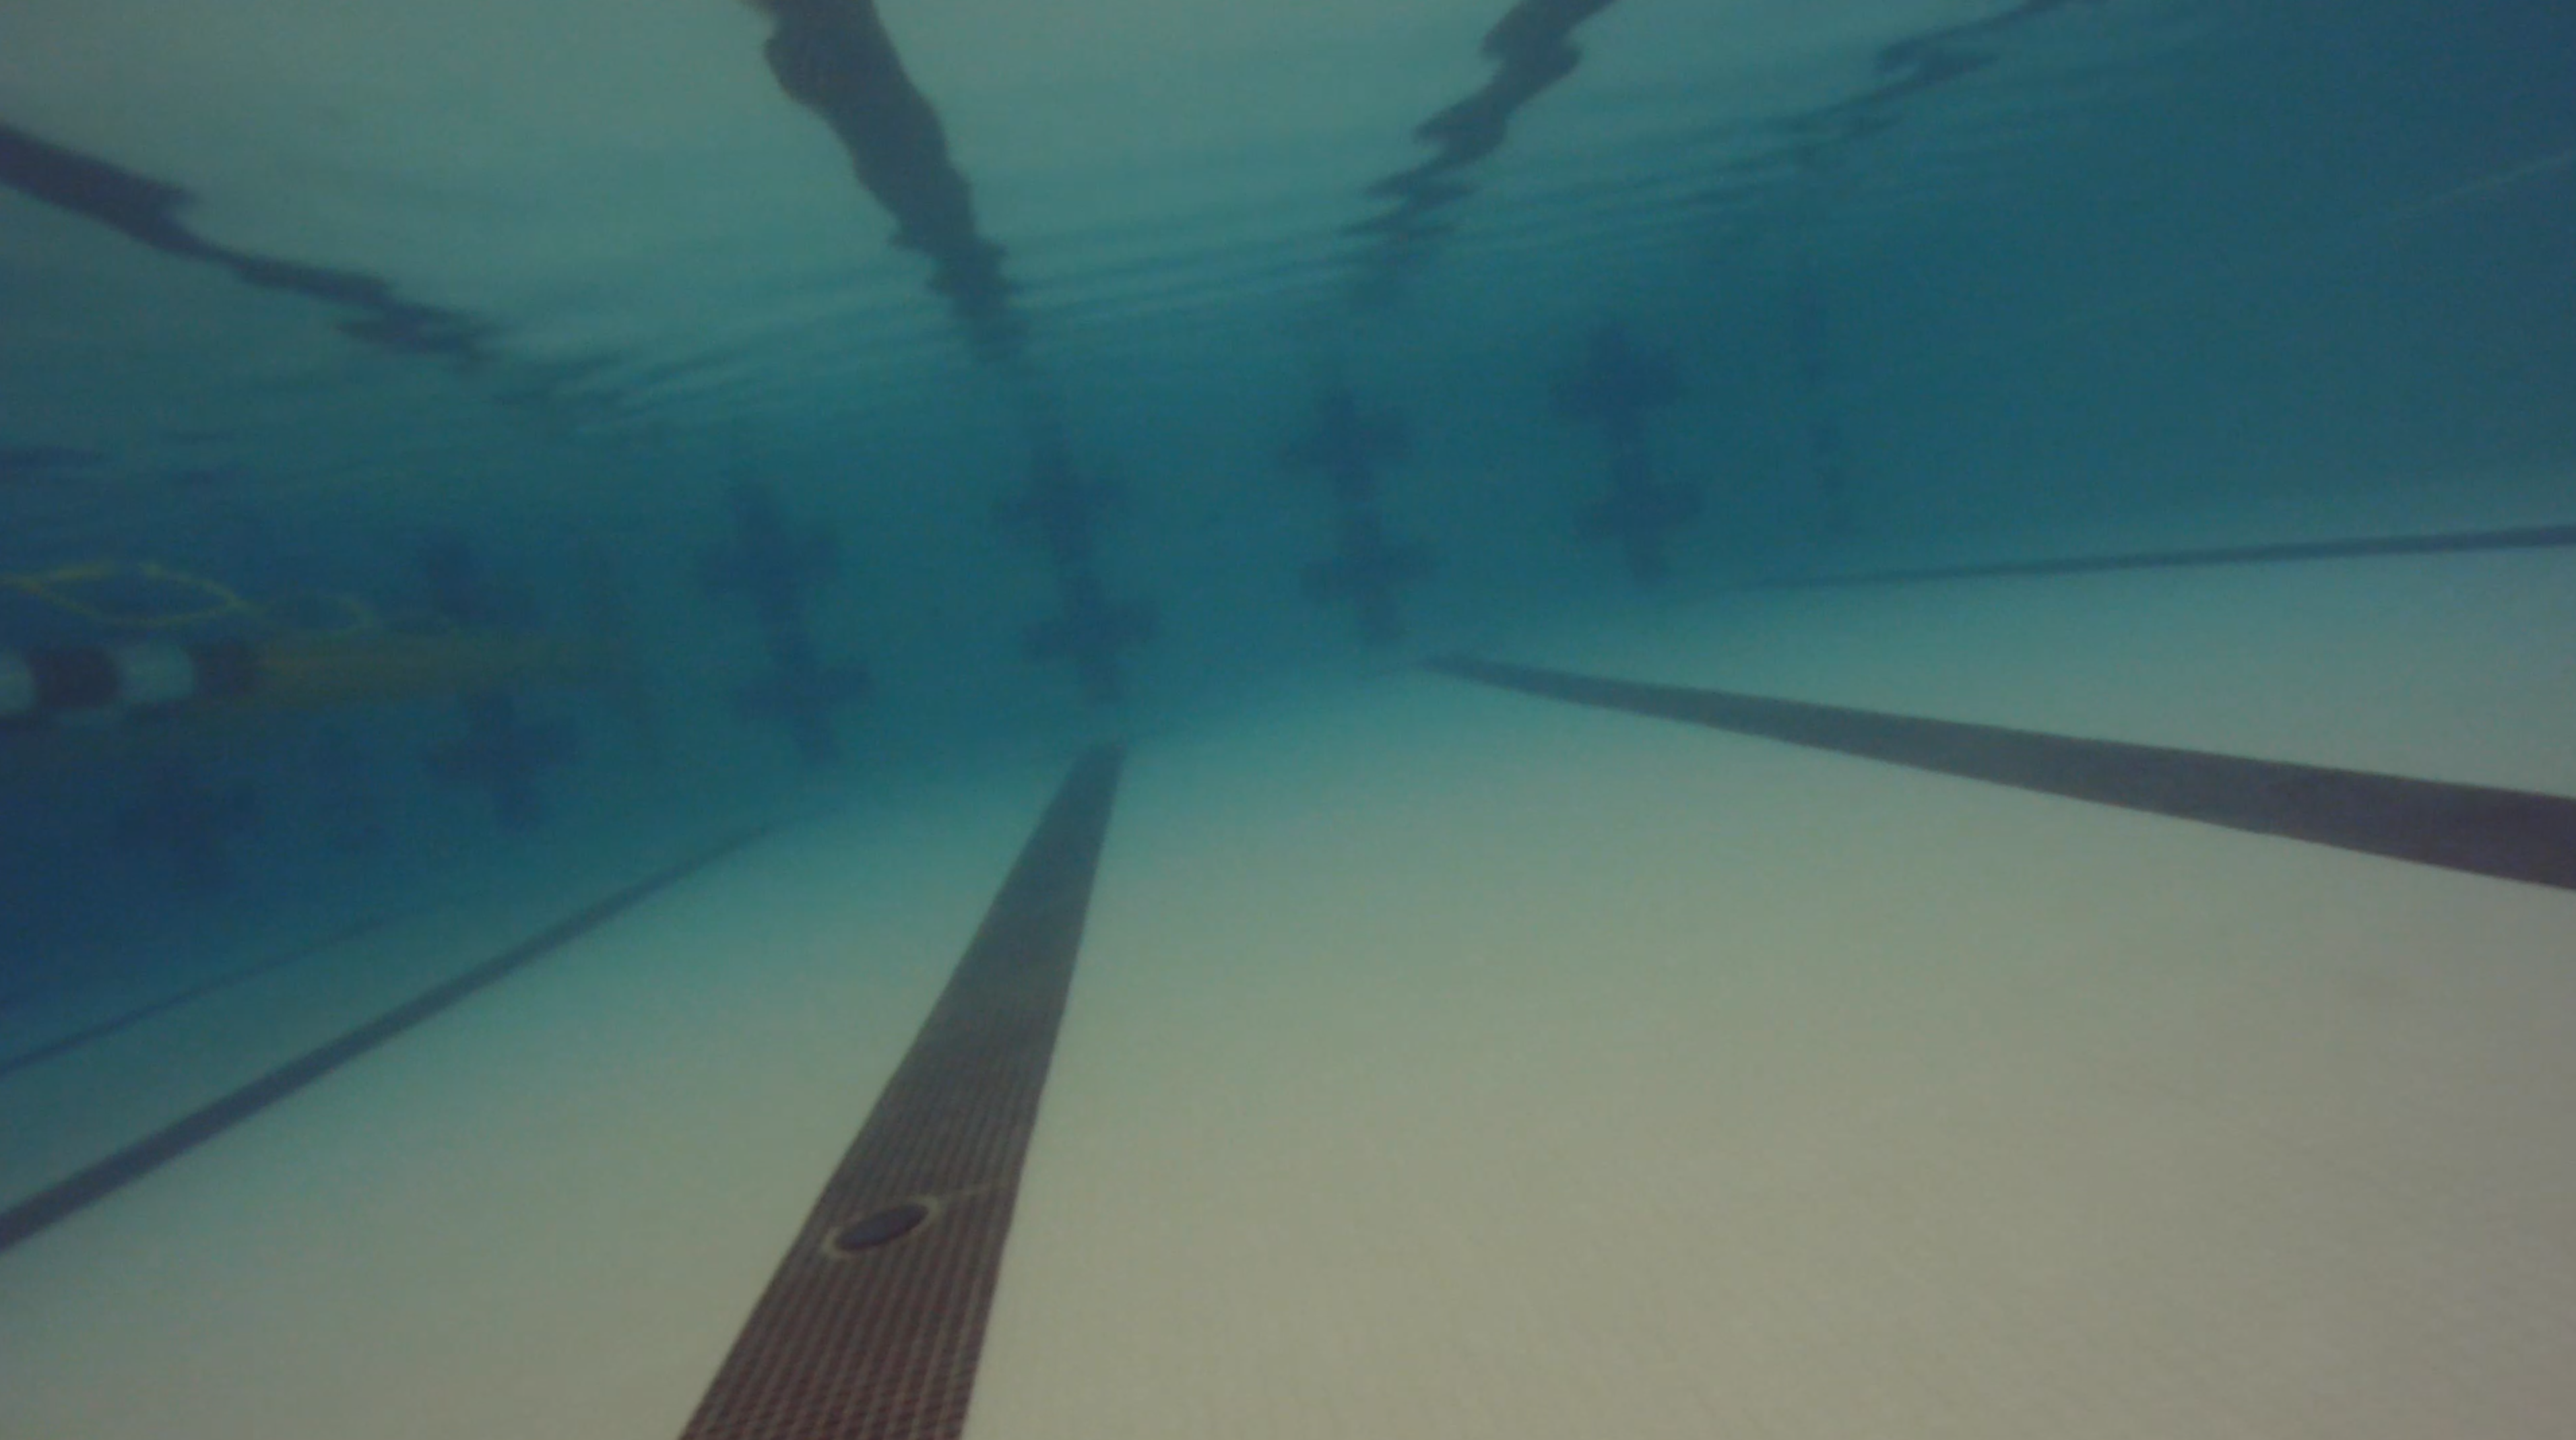
Create a new Jupyter notebook lane_detection.ipynb and test your code.
Problem 2: Lane Following
In a new file lane_following.py:
-
Write a python function
get_lane_centerthat takes a list of lanes as an input and returns the intercept and slope of the closest lane. The function should take the following parameters:lanes: the list of lanes to process
The function should return the following parameters:
center_intercept: the horizontal intercept of the center of the closest lanecenter_slope: the slope of the closest lane
The function should use the functions written in the previous problem set.
-
Write a python function
recommend_directionthat takes the center of the closest lane and its slope as inputs and returns a direction. The function should take the following parameters:center: the center of the closest laneslope: the slope of the closest lane
The function should return the following parameters:
direction: the recommended direction
The function should do the following:
- If the center is on the left of the image, return
left. - If the center is on the right of the image, return
right. - If the center is in the middle of the image, return
forward.